U.S. Distribution Sourcing Exposure: What Freight-Flow Data Can Show
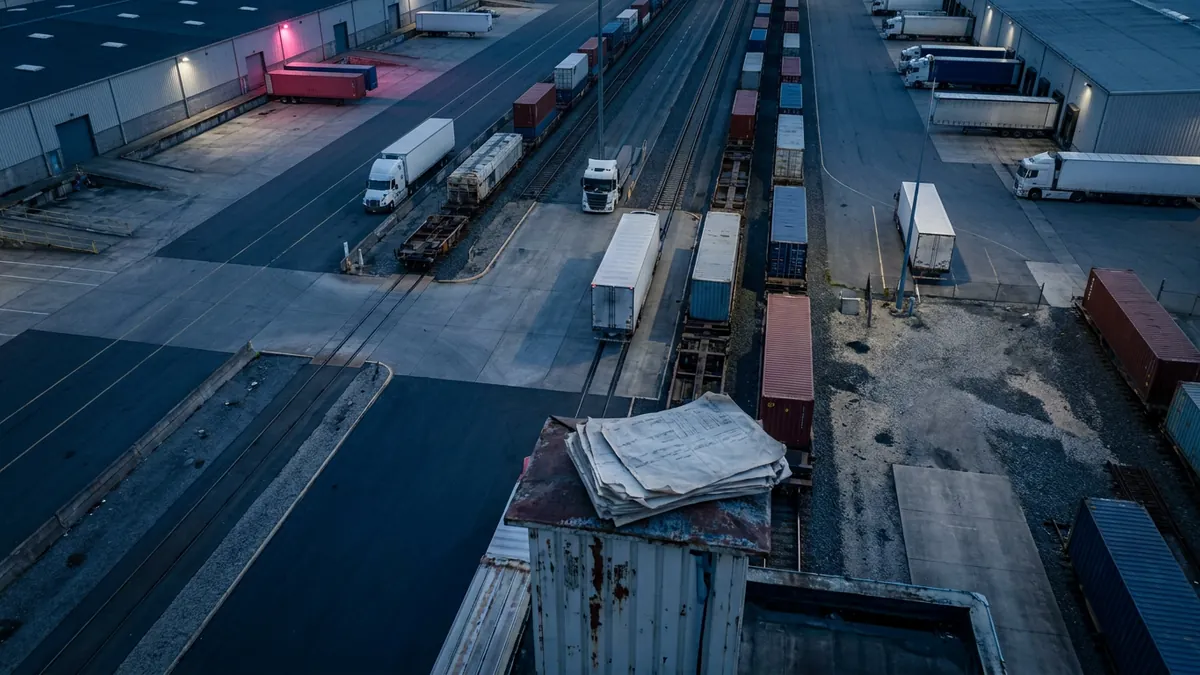
“A regional freight map is a question about exposure. A sourcing decision begins when the buyer can connect that question to its own lanes and service obligations.”
What is the unit of observation?
The Census description of the Commodity Flow Survey calls it a shipper-based measure of domestic freight. It collects commodity, value, weight, origin, destination and mode information from establishments in its defined population. That makes the survey useful for understanding broad movement, but its reporting unit is not a procurement event. A distribution company’s purchase order, negotiated carrier rate, warehouse service agreement and customer delivery promise are different records. A map built from the survey should therefore be labeled as a public movement view, with the population and unit visible to everyone who uses it.
The same survey scope excludes imported shipments and those originating in U.S. territories. It covers mining, manufacturing, wholesale trade, selected retail and services, and some auxiliary establishments within scope. Census describes a sampled establishment design rather than a census of every buyer lane. For a distributor moving imported inventory through several facilities, those boundaries matter before anyone draws a coverage map. The public view can help ask which regions or commodity classes deserve attention; it cannot certify that the company’s actual shipments are represented in the same proportion.
How fresh is a freight table?
A Census data page identifies the Commodity Flow Survey’s observation vintage and the later release of its tables and public-use data. That distinction prevents a common sourcing mistake: calling a released table “current” without saying when the shipments occurred. In a working paper, retain the source title, version, observation period, publication date, geography and unit alongside each extracted field. A change in freight demand since that observation period remains a hypothesis unless the analyst has comparable later evidence. The page also links to technical documentation; a decision owner should inspect definitions and notes before copying a cell into a category plan.
Census describes public-use files with identifying information removed for confidentiality Census release information. This is a useful boundary in itself. A row that resembles a specific corridor or product class is not a disclosure of one distributor’s shipments or one carrier’s contract. Analysts can use that row to ask whether an internal lane has similar directional exposure. They should not use it to estimate the company’s freight bill, infer a supplier’s share or publish a named firm conclusion. Confidentiality protection is part of the source method, not a gap that a clever query can reverse.
What does the framework add?
The Federal Highway Administration’s FAF description says the framework combines the survey with trade and other sector inputs to represent freight movement across states and major metropolitan areas. It is broader than the survey, and its modeled coverage has a different evidentiary status from a reported establishment shipment. A buyer can use it to scan geographic and modal context, provided the version and method are named. A corridor with substantial aggregate flow may be worth testing against the buyer’s private lanes. That flow does not establish that the buyer has access to carriers, capacity, service quality or favorable rates on that corridor.
The FHWA page describes an update to a newer benchmark based on a later survey vintage. A planning team should never splice a field from one FAF version into a table from another and then call the difference a trend. First check population, commodity classification, geography, mode definitions, units and observation years. If any of those changed, carry the versions as separate descriptions until a documented crosswalk supports comparison. The question for procurement is usually narrower than a national trend: which internal category or lane deserves a fresh quote, service review or continuity test?
Which public fields can frame a sourcing hypothesis?
The Oak Ridge FAF5 documentation identifies tonnage, value and ton-miles by regional origin–destination pair, commodity and mode. These are movement measures, not supplier price fields. For example, a distributor may identify a region and commodity combination worth investigating, then ask its transport team whether the company actually moves that commodity between those places. The next questions concern seasonality, handling, equipment, routing and promised delivery windows. No FAF field answers whether a carrier quoted the lane, met the service level or accepted the liability terms. Keep the public cell separate from the internal evidence request.
The FAF5 page also distinguishes a base year, subsequent estimates and forecasts. These are different products even when shown in one interface. A forecast is a scenario about future movement under model assumptions; it is not booked demand or a carrier capacity reservation. If a category manager uses it to frame a contingency, the slide should say “scenario” and record the underlying version. Any budget or sourcing event should then turn on the company’s own volume forecast and supplier response, with the public estimate retained as context rather than promoted into a commitment.
How does a buyer make the boundary operational?
| Public signal | Question worth asking | Buyer evidence before action |
|---|---|---|
| CFS commodity and origin–destination view | Does this commodity or corridor overlap our operating footprint? | Shipment ledger by facility, actual origin, destination, mode and observation period |
| CFS survey population and exclusions | Are imports, territories or out-of-scope activities material to us? | Inbound and outbound lane register, customs movements and facility ownership |
| FAF regional flow and mode estimate | Which modal dependency merits a resilience or bid test? | Carrier coverage, equipment need, capacity quote, service commitment and fallback route |
| FAF scenario or later benchmark | Which assumption should be tested rather than treated as demand? | Internal forecast, customer promise, scenario owner and date for review |
Authored decision aid. A public flow is a lead for a question, not a buyer rate, supplier ranking, savings estimate or proof of service.
The table deliberately leaves the commercial answer in the third column. A procurement lead can choose one category and one facility cluster, state the public observation in its original unit, and assign an internal owner to test overlap. If the buyer has no matching flow, record that result and stop. If it does, request a common lane definition and service requirement before asking carriers for comparable responses. This sequence keeps “high regional activity” from turning into “good rate opportunity” by assertion. It also lets finance and operations see exactly which source, assumption and missing record shaped the decision.
What belongs in the buyer record?
- Scope each actual lane: origin and destination facility, shipment class, volume range, seasonality, handling constraints, delivery window and service exception history.
- Separate the company’s movement from the public observation: record the source version and whether the proposed category, geography and mode really overlap.
- Ask carriers or service providers for equipment and coverage, capacity windows, accessorials, contingency arrangements, claims handling and the exact contract exceptions they need.
- Compare bids on the same lane and service specification; assign operations, procurement, finance and legal owners to unresolved tradeoffs.
- Keep a dated decision log with the public lead, private evidence, supplier response, rejected inference and next review trigger.
This is a proportionate checklist, not a universal freight tender. A parcel network, temperature-controlled lane and bulk commodity movement have different constraints. The buyer should remove fields that do not change the decision and add category-specific safety or compliance requirements when they do. The point is traceability: an analyst should be able to show which public pattern led to a question, which internal data confirmed or contradicted it, and which commercial evidence supported the eventual award. A gap stays open until the responsible owner closes it; it does not become a numerical score by being placed in a table.
For a related treatment of supplier continuity choices, see the dual-sourcing operational strategy. When a distribution footprint includes overseas supply, the nearshoring total-cost governance guide gives a separate frame for evaluating the full landed decision. These are adjacent methods, not evidence that a public freight dataset can establish a company’s rate or supplier suitability.
What is the usable conclusion?
Sources
- About the Commodity Flow Survey — U.S. Census Bureau, 2026. Foundational evidence (official report): Source scope, version, available fields, and limits of public freight evidence.
- Commodity Flow Survey — U.S. Census Bureau, 2025. Current empirical evidence (official report): Source scope, version, available fields, and limits of public freight evidence.
- Freight Analysis Framework — Federal Highway Administration, 2026. Foundational evidence (official report): Source scope, version, available fields, and limits of public freight evidence.
- Freight Analysis Framework Version 5 — Oak Ridge National Laboratory, 2026. Historical evidence (official report): Source scope, version, available fields, and limits of public freight evidence.